Choose KPIs that describe the real journey
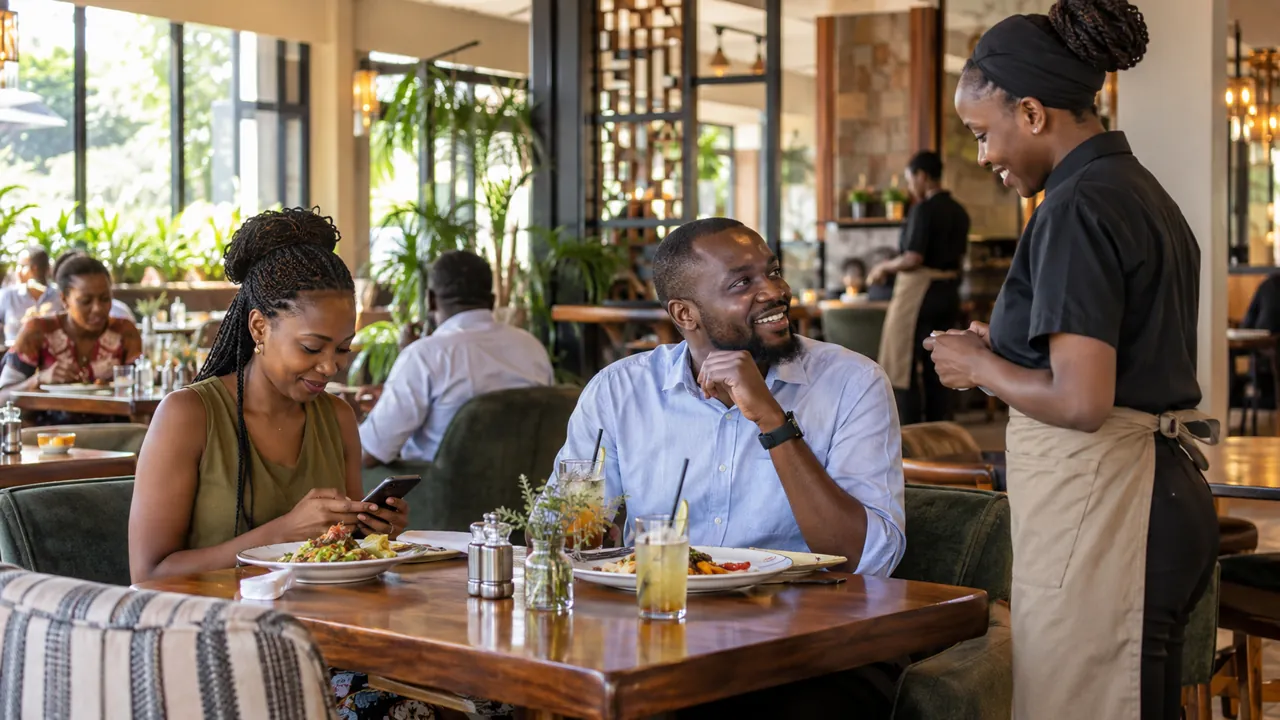
Restaurant customers judge both food and the flow around it: welcome, menu guidance, timing, accuracy, cleanliness and payment. The best mystery shopping KPIs do not reward activity that customers cannot feel. They measure whether the expected service happened, how long it took and whether the customer reached a clear outcome.
For restaurants and food-service outlets, measurement should cover welcome and seating, menu availability and staff knowledge, order accuracy, food and beverage timing and bill accuracy and farewell. Each KPI needs a definition, evidence rule and scoring threshold that every shopper can apply in the same way.
Core service KPIs
Useful measures include access or arrival readiness, acknowledgement, waiting time, staff knowledge, needs discovery, accuracy, compliance, resolution and quality of the close. The exact weighting should reflect the risk and commercial importance of each stage.
Averages alone can hide poor locations. Report the percentage of visits meeting the standard, the range between branches and the number of critical failures as well as the overall score.
- welcome and seating
- menu availability and staff knowledge
- order accuracy
- food and beverage timing
- bill accuracy and farewell
Evidence behind every score
The programme may use service timestamps, receipt details, table and facility observations and factual notes on the interaction. Evidence should confirm the visit and explain the rating, not collect unnecessary personal information.
Quality reviewers should flag contradictions, implausible timings, copied notes and scores that are not supported by the narrative. This is essential before a dashboard is shared with managers.
Reading the dashboard correctly
Compare like with like. Branch size, visit time, product availability and customer scenario can affect performance. Segment the results where those differences matter rather than forcing every visit into one league table.
Operators can use results to strengthen table service, menu knowledge, order accuracy and recovery when something goes wrong. The dashboard should make the next management action obvious instead of simply displaying attractive charts.
Use trends, not one-off rankings
One round establishes a baseline. Repeated waves show whether coaching, process changes or staffing decisions improve the journey. Keep the core KPI definitions stable so the trend remains comparable.
Rudder Research and Data Analytics LTD can design the scorecard, run visits and prepare a clear branch dashboard for Kenyan service organisations.
Frequently asked questions
How many restaurants and food-service outlets visits are needed?
The right number depends on the decision, number of locations, customer scenarios and whether management needs a baseline or a statistically stable trend. A pilot can confirm the practical sample before a wider wave.
Can visits be completed outside Nairobi?
Yes. Rudder Research and Data Analytics LTD can coordinate mystery shopping in other Kenyan towns and counties where the locations, timing and evidence requirements are clearly defined.
What does the client receive?
Deliverables can include a quality-checked visit dataset, branch scorecards, shopper narratives, evidence where appropriate, a management summary and an action tracker.